
Last month the climatologist Justin Maxwell from Indiana University gave an interesting talk at our department about drought-busting tropical cyclones. In his talk, and in conversations before and after with our physical geography crew, he had some interesting things to say about climate teleconnections involving mainly sea surface temperature and pressure patterns such as ENSO, NAO, etc. If teleconnections and the various acronyms are unfamiliar, check out the National Climatic Data Center’s teleconnections page: http://www.ncdc.noaa.gov/teleconnections/
In the northern hemisphere there are at least 10 of these that influence our weather and climate. So after talking and listening to Justin I got the idea to apply some algebraic graph theory methods I’ve been using to assess complexity and to identify patterns in geomorphology and pedology to these teleconnections. The idea was to set up a network (graph) where each of these teleconnection patterns is a node. These nodes would be considered positively connected if their phases are synchronized—that is, they both tend to be in positive or negative phases at the same time. A negative connection would exist if they tend to be in opposite phases, and no link if their phases are apparently unrelated.
I got the time series of monthly teleconnection pattern indices here: http://www.cpc.ncep.noaa.gov/data/teledoc/telecontents.shtml. I then used these time series (1950 to present) to try to identify the connections. Unfortunately, the plots all look more or less like this:
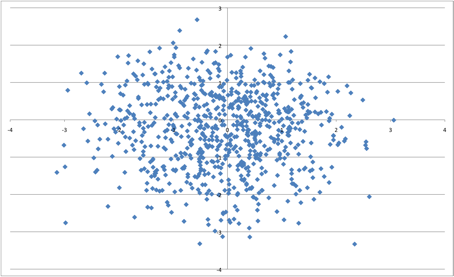
Plot of values of the North Atlantic Oscillation (NAO) index (vertical axis) vs. the East Atlantic (EA) index (horizontal axis).
Once could interpret this either of two ways. One is that the indices are all unrelated to each other, producing a meaningless graph/network of completely unconnected nodes. Another interpretation is that ALL connections are possible—that is, a positive or negative phase of any teleconnection pattern may be associated (synchronous) with a positive or negative phase of any other. This would result in mathematical graph of the maximum possible complexity for the number of nodes.
Climatologists are increasingly able to explain more and more phenomena based on these teleconnection patterns, and that trend will continue. But my little foray into that work shows that as all of these global teleconnections operate contemporaneously, with their weather and climate impacts superimposed on each other, the system is extremely and inherently complex—consistent with earlier determinations of chaotic dynamics of the atmosphere.
As Yogi Berra is supposed to have said: “Prediction is difficult; especially the future.”